Exploring the Correlation Between CEO Ownership and Corporate Performance: A 2010-2020 U.S. Firms Analysis
Executive Summary:This report stands from an analyst’s perspective who is preparing an investment investigation for investors evaluating whether there is a significant correlation relationships between CEO ownership and corporate performance within U.S. firms from 2010 to 2020. The motivation behind this report stems from the ongoing debates on the effectiveness of share-based payments (SBPs) as a tool aligning the interests of executives and shareholders to solve agency problems and enhance corporate governance and performance. The study uses linear regression methods to explore how CEO ownership impacts Return on Assets (ROA), a key corporate performance indicator. The analysis is also segmented by different scenarios including years (before and after 2015), firm size, Market-to-Book Ratio (MBR), and leverage. The primary objective is to determine whether higher CEO ownership in companies correlates with better corporate performance and whether this relationship varies across different corporate environments.In this research, there is a significant positive relationship between CEO ownership and ROA under controlling for firm size, MBR, and leverage. Separating the samples into two groups based on year, a positive relationship between CEO ownership and ROA in post-2015, suggesting that recent enhancements in equity payment methods may be effectively binding CEO interests to those of the company and its shareholders. Inconsistent relationships appear in the impact of CEO ownership across different firm sizes, MBR, and leverage levels on corporate performance. Larger firms, high MBR firms, and high-leverage firms do not exhibit a strong correlation between CEO ownership and ROA. This can be attributed to the complex agency problems in larger entities, earnings management, and the prioritization of debt management over performance enhancement in highly leveraged firms.
keywords:CEO Ownership,Corporate Performance,ROA
I.Introduction
Share-based payments (SBPs) are a form of remuneration that effectively links management's financial results to the corporate performance aligning managers' (agents) and shareholders' (principals) interests (Core, Guay, and Larcker, 2003). Since the accounting treatment of SBPs has been regulated in IFRS 2 (2004), the importance of SBPs in corporate financial reporting has increased further (Giner and Arce, 2012). In the modern executive remuneration structure, paying managers with SBPs instead of cash as part of bonuses is becoming more and more popular (Galbo 2020). Bolatto and Pignataro (2023) point out that many governments also provide fiscal incentives to support SBP promotion. From the investor's perspective, considering corporate governance issues (such as executive compensation structure) when making investment decisions is necessary since well-governed companies can closely align the interests of managers and investors, thereby reducing agency costs and increasing shareholder wealth (Dai et al., 2017). Theoretically, SBPs managers to take actions beneficial to investors, because managers' expectations of their future returns largely depend on the performance of stocks in the SBPs' remuneration contract leading to managers' preferences and actions focusing on increasing company value (Nyberg et al., 2010). Furthermore, although good corporate performance is achieved by the entire management team’s joint efforts, the chief executive officer (CEO) plays a significant leading role in decision-making, so the CEO's performance is important to increasing the company's value (Hamidlal and Harymawan, 2021). So, understanding the specific relationship between CEO ownership and corporate performance in different scenarios helps investors make better investment decisions.
There are a large number of studies that have explored various aspects of SBPs' influence on corporate performance, especially CEO ownership, but the specific impact remains controversial (Saidu, 2019). Guerdon Associates (2006) reports a significant relationship between CEO ownership and Australian company performance over 1, 5, and 10-year periods, and the relationship with long-term performance is stronger than short-term, so CEOs with a substantial holding in company shares will likely create higher returns to investors over the longer term. Papadopoulos (2019) proposes that most American companies encourage CEO ownership to align interests, and the data suggests this is useful to achieving superior performance and economic incentives are better than giving management control power, therefore, investors should consider companies’ equity structures to avoid the risk of CEO's power expansion. Hamidlal and Harymawan (2021) find that CEO ownership has a positive relationship with corporate value because CEO ownership improves CEOs' decision quality for companies' long-term performance by using various linear regression models for Indonesian companies‘ data during 2014-2018. However, as early as 2006, Carlin and Ford argued their concern of high shareholding concentration in Australian listed companies that leads to decision-making and wealth concentration in a small number of people within companies may harm public investors' interests, so investors need to consider the dispersion of executive's ownership. After that, Bebchuk, Cremers, and Peyer (2010) suggest the relationship between CEO ownership and corporate performance is influenced by other factors, in some cases, there is a negative relationship between them. This is because higher remunerations bring more agency costs (expenses) and inversely impact company market returns (Jiraporn, Chintrakarn, and Liu, 2011). Wei (2019) proposes contradictory, both positive and negative relationships between CEO ownership and corporate performance through her survey of hundreds of CEOs in Chinese companies.
With the development of big data technology, Stata is a powerful tool for data research practice (Tiong, 2017). This report aims to analyze the relationship between CEO ownership and corporate performance under controlling
variables of firm size, market-to-book ratio (MBR), and leverage through US companies' data from 2010 to 2020 using linear regression methods.
II.Methods
Population, Sample, and Deive Statistics
This study uses statistical analysis on real-world datasets capturing corporate and CEO characteristics. The population of this report is targeting US companies from various industries. Data on corporate and CEO attributes are collected from a selection of US firms from 2010 to 2020. After data cleansing and merging operations, the final sample includes data records of 15491 observations on 2075 companies.
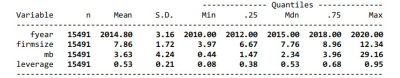
Deive statistics is conducted on variables used to divide the dataset into portions for testing the hypotheses, including financial year (year), firm size (firm size), MBR (MB), and leverage (leverage). Statistics are provided for each variable, including the number of observations, mean, standard deviation, minimum, median, and maximum values. The median value of each variable is selected as the measure to divide the dataset into two groups with similar amounts of data. Details on how the firm size, mb, and leverage are calculated are provided under Control Variables in the Linear Regression Model section.
Table 1univar year firm size mb leverage
Hypothesis Testing
Stemming from the above literature and database, this report aims to investigate the following hypothesis:
![]()
Furthermore, this report also aims to test the hypothesis under the following juxtaposed scenarios:
i. Relationship before versus after 2015;
ii. Relationship in small versus large companies;
iii. Relationship in companies with lower versus higher market-to-book ratios;
iv. Relationship in companies with lower versus higher leverage ratios.
Linear Regression Model
Dependent and Independent Variable
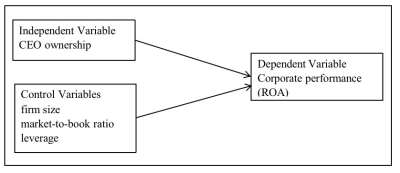
This report aims to test correlations between CEO ownership and corporate performance. Specifically, it postulates the applicability of using CEO ownership at the start of a financial year as a predictor of Return on Assets (ROA) over that financial year. Hence dependent variable is selected as firm ROA collected in the sample, whereas the independent variable is CEO ownership collected during the previous year.
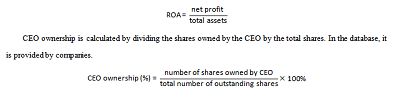
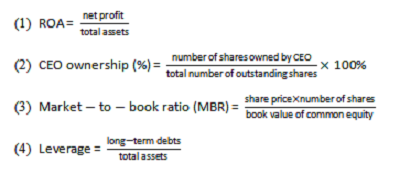
ROA is a helpful key performance indicator of corporate performance for companies within the same industry (Marr, 2012) and provides a comprehensive view of management performance and the company's overall profitability by outlining the company's ability to generate profits using total assets (Griffith, Fogelberg and Weeks, 2002), whichis calculated by dividing net profit by total assets (Ali, Shah and Jan 2015). In Stata, it is calculated by roa=ib/at.
Control Variables
This model also incorporates control variables to aid in explaining the variability of the dependent variable and maintain model consistency. The addition of control variables that are partially correlated with the dependent variable helps reduce endogeneity and prevents the omitted-variable bias (Nizalova and Murtazashvili, 2016). The three control variables below have been selected for this purpose.
Papadopoulos (2019) indicates that higher CEO ownership leads to better interest alignment between management and shareholders and the impact may vary across firm sizes. Firm size also significantly influences corporate performance directly, with larger companies demonstrating higher profitability through better resource utilization (Bhakar, Sharma, and Kumar, 2024). As the firm size's influence on CEO ownership policies and corporate performance, firm size is identified as a control variable first. It is calculated by firmsize=ln(at+1) in Stata to compress the range of data and reduce the impacts of extreme values and skewness.
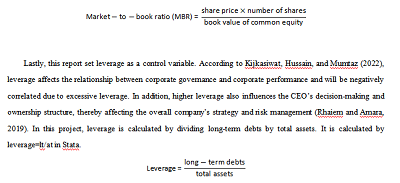
The next control variable is MBR which is calculated by dividing the market value of total shares by the book value of common equity. A higher MBR indicates that investors expect strong future growth and profitability of the company (CFI Team, 2023), CEO is also willing to hold more shares. In this atmosphere, the company's growth is more affected by market confidence (Wall Street Prep, 2023). The higher MBR may also as a result of managers manipulating the company's stock price to profit from SBPs (Kothari, Mizik, and Roychowdhury, 2016). In Stata, it is calculated by mb=(csho*prcc_f)/ceq.
Regression Model
To study the proposed linear relationship between involved variables, this report uses an ordinary least-squares regression model on the sample datasets.
The regression model in general is:
O: CEO ownership (CEO ownership)
F: firm size (firm size)
M: market-to-book ratio (MB)
L: leverage (leverage)
In this linear regression model, α intercepts the regression line image's function which is the value of ROA when CEO ownership equals zero. β describes the change in ROA as 1 change in CEO owners epsilon is the error factor that captures random issues not included in the model, which may cause unexpected changes in ROA. For the entire model, R-squared (range from 0 to 1) indicates the proportion of variance in the dependent variable can be explained by independent variables with higher values indicating a better fit. The significance will be tested by a p-value threshold of less than 0.05. When the p-value is less than 0.05, the dependent variable (ROA) and independent variable (CEO ownership) have a significant relationship. Conversely, no significant relationship between them. After showing a significant relationship, the positive or negative coefficient (Coef.) value will be used to represent whether the relationship is positive or negative.
III.Results
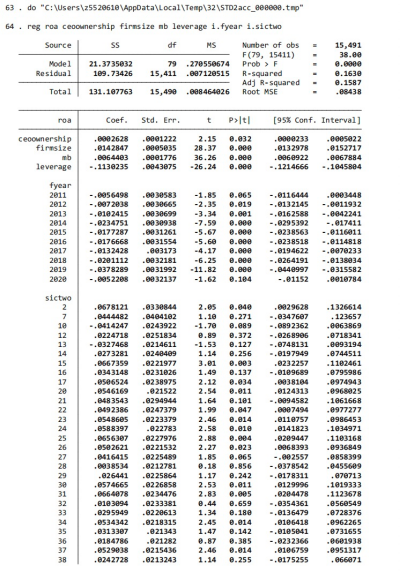
The results present the research on the relationship between CEO ownership and corporate performance (represented by ROA) under controlling firm size, MBR, and leverage by using a linear regression model and all the regression runs with the inclusion of factor variables for the fiscal year (fyear) and the industry classification (sictwo) that controls the effects of specific years and industries allows for more accurate estimates of the effects of other variables in the model.
1.Test the association between ROA and CEO ownership when controlling for the effect of firm size, MBR, and leverage.
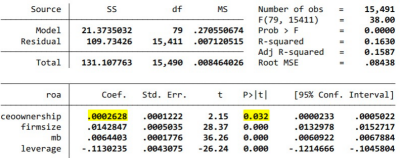
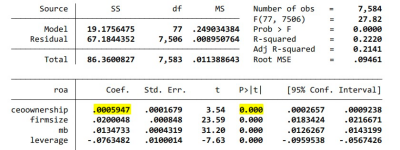
In this linear regression model with ROA as dependent variable and CEO ownership as independent variable, controlling for firm size, MBR and leverage, the p-value of 0.032 (<0.05) and the positive coefficient of 0.0002628 indicate that the result is statistically significant at the 95% confidence level which suggests a significant positive relationship between CEO ownership and ROA and has 95% confidence to reject . However, the R-squared value of 16.3% shows that this model can only explain a small portion of the variability in ROA, implying a weak overall fitting effect. It may be due to factors affecting firm performance are complex and this model does not include all variables that have significant effects (Saidu, 2019). This finding still supports the perspective that CEO ownership and corporate performance are positively correlated.
Table 2reg roa CEO ownership firm size mb leverage i.fyear i.sictwo
2.Test the association between ROA and CEO ownership for years after 2015 and before 2015 when controlling for the effect of firm size, MBR, and leverage.
In the years after 2015, the p-value is 0.037 (<0.05) and="" the="" positive="" coefficient="" of="" 0.0003926="">0.05), so CEO ownership and ROA do not have a significant relationship in this period. Between 2001 and 2014, restricted stock replacement options became the most popular equity compensation method, after that, various complex SBPs appeared to use one or more performance metrics bonding managers' interests closer to corporate performance (Edmans, Gabaix, and Jenter, 2017). The relationship between CEO ownership and ROA also became significant.
Table 3 reg roa CEO ownership firm size mb leverage i.fyear i.sictwo if fyear>2015
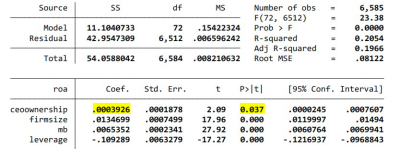
Table 4 reg roa CEO ownership firm size mb leverage i.fyear i.sictwo if fyear<2015<>
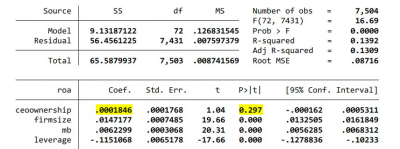
3.Test the association between ROA and CEO ownership for large firms and small firms when controlling for the effect of firm size, MBR, and leverage.
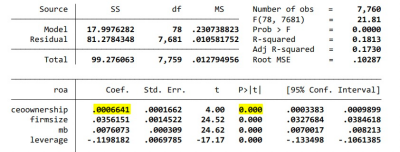
Large firms do not have a significant relationship between CEO ownership and ROA (p-value>0.05), but small firms have a significant positive relationship between them (p-value=0, positive coefficient). Swastika (2013) finds that large companies are more likely to experience more complex agency problems, so the quantity of CEO ownership cannot represent their benefits directly and more factors need to be considered, such as capital structure, shared control rights the relationship between CEO and boards.
Table 5 reg roa CEO ownership firm size mb leverage i.fyear i.sictwo if firmsize>7.76
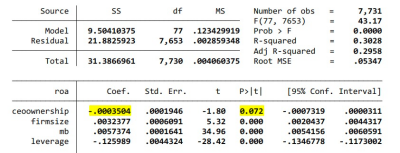
Table 6 reg roa CEO ownership firm size mb leverage i.fyear i.sictwo if firmsize<7.76<>
4.Test the association between ROA and CEO ownership for high MBR firms and low MBR firms when controlling for the effect of firm size, MBR, and leverage.
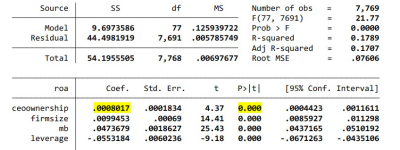
There are significant positive relationship between CEO ownership and ROA (p-value=0, positive coefficient) when MBR is less than 2.34, but high MBR firms are not (p-value>0.05). Because high MBR sometimes means companies joining high-risk and high-return projects (Peterkort and Nielsen, 2005), the link between CEO ownership and ROA might be diluted by volatility and uncertainty. If the high MBR is caused by earnings management, corporate performance cannot develop stable and will be poor in subsequent periods (Raoli, 2013).
Table 7reg roa CEO ownership firm size mb leverage i.fyear i.sictwo if mb>2.34
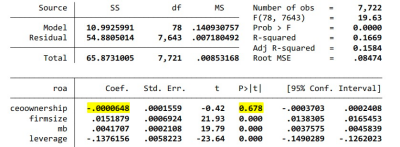
Table 8 reg roa CEO ownership firm size mb leverage i.fyear i.sictwo if mb<2.34<>
5.Test the association between ROA and CEO ownership for high-leverage firms and low-leverage firms when controlling for the effect of firm size, MBR, and leverage.
The relationship between CEO ownership and ROA is significantly positive in low-leverage companies (p-value=0, positive coefficient). When the leverage is higher than 0.53, there is no significant relationship between them (p-value>0.05). High leverage means lots of debt in companies causing management's focus to shift from long-term strategic to short-term debt management and cash flow issues, which may weaken the impact of CEO stock ownership on improving ROA because managing debt is the priority over other performance-enhancing activities (Faulknder and Wang, 2006).
Table 9reg roa CEO ownership firm size mb leverage i.fyear i.sictwo if leverage>0.53
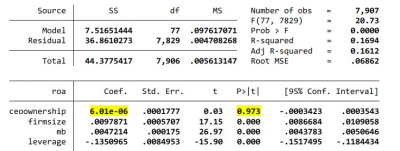
Table 10reg roa CEO ownership firm size mb leverage i.fyear i.sictwo if leverage<0.53<>
IV.Implications
The result is consistent with classical agency theory, which includes a significant positive relationship between CEO ownership and ROA. However, when samples are divided into groups by the median value of the financial year, firm size, MBR, and leverage, the relationship becomes complex. From investors' perspective, since the enrichment of equity payment methods aligns interests better and the significant positive relationship between CEO ownership and ROA after 2015 (Edmans, Gabaix, and Jenter, 2017), it is reasonable to predict greater CEO ownership will lead to better corporate performance. However, in large companies, CEO ownership and ROA do not have a significant relationship, which is against common sense, because larger companies usually offer more complex incentive remuneration packages to executives due to their more diversified operations and the broader scope of responsibilities, especially SBPs (Skapinker, 2015). Huang, Marquardt, and Zhang (2013) attribute the reason to large companies being more susceptible to various factors, such as macroeconomic factors, regulatory changes, and market conditions, which decrease CEO ownership's impact on firm performance. In small firms, CEO ownership may become a larger percentage of total equity, whose personal interests are more affected by corporate performance, so investing in small firms, investors could attention to CEO ownership (Deb and Wiklund, 2016). CEO ownership and ROA also do not have a significant relationship in high MBR companies. Hassan and Ahmed (2012) indicate that the market believes higher MBP is due to earnings management to gain more SBPs’ benefits, therefore, the high MBR cannot be maintained, but they still insist that there is a positive interaction between executive compensation and corporate performance. Furthermore, because high leverage leads to asset substitution and under-investment (Vintila and Gherghina, 2012), managers more focus on repaying the debts and keeping cash flow, so SBPs have no significant effect in motivating corporate performance (Rao, Khursheed, and Mustafa, 2020). So that, at lower MBR and leverage, investors can refer to the role of a significant positive relationship between CEO ownership and ROA in increasing corporate performance.
V.Limitation
Firstly, Redman (2001) states without high-quality data, any analysis is suspect, so emphasizing the quality of data over just volume is crucial. In big data analysis, even the research collecting large amounts of samples, the effective sample size for some subgroups (such as female CEOs) is still limited which caused data bias, because
he significant underrepresentation of females means their potential impact cannot be fully realized or understood in empirical studies (Adams and Ferreira, 2009). Some items that influenced CEO ownership and corporate performance are not included in the database (Ali et al., 2022). So extending the sample size with more valuable data and increasing control variables will make the model more accurate.
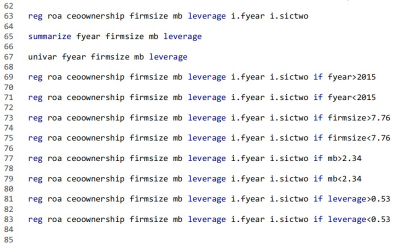
Secondly, several other methods can be supplemented in this research to fruitful results. The binomial distribution can be used in specific scenarios to statistically model the process directly of results in a binary outcome that is categorized as success or failure, such as CEO gender and whether they have received higher education. Nonlinear regression is also used as an extension to simulate more complex nonlinear relationships between the dependent variable and independent variables, such as polynomial, exponential, and logarithmic mathematical models. The general form of a nonlinear regression model is dependent variable, x is the independent variable, β is the model parameter, f is the function describing the nonlinear relationship between x and y, and ϵ is error factor.
Thirdly, there are limitations in big data analysis, especially the linear regression model. Neuberg (2003) mentions a major challenge is distinguishing between correlation and causation to understand the underlying causal mechanisms behind data requiring a careful and nuanced approach to combine with narrative evidence beyond surface correlations. With machine learning's development (such as artificial intelligence), natural language processing (NLP) and sentiment analysis help capture narrative information effectively in data mining.
Conclusion
In conclusion, this report establishes a significant positive correlation between CEO ownership (independent variable) and corporate performance (ROA represented, dependent variable) by linear regression model under control variables of firm size, MBR, and leverage, highlighting complexities in separating samples in different groups by medians
Bibliography
[1] Adams, R.B. and Ferreira, D. (2009). Women in the boardroom and their impact on governance and performance.Journal of Financial Economics, 94(2), pp.291–309. doi https://doi.org/10.1016/j.jfineco.2008.10.007.
[2] Ali, A., Shah, A. and Jan, F.A. (2015). Leverage, Ownership Structure and Firm Performance: Evidence from Karachi Stock Exchange.Journal of Management Info, 2(2), pp.1–7. doi:https://doi.org/10.31580/jmi.v6i1.41.
[3] Ali, J., Tahira, Y., Amir, M., Ullah, F., Tahir, M., Shah, W., Khan, I. and Tariq, S. (2022). Leverage, Ownership Structure, and Firm Performance.Journal of Financial Risk Management, [online] 11(1), pp.41–65. doi:https://doi.org/10.4236/jfrm.2022.111002.
[4] Bebchuk, L.A., Cremers, K.J.M. and Peyer, U.C. (2010). The CEO Pay Slice.Journal of Financial Economics, 102(2011), pp.199–221. doi:http://dx.doi.org/10.2139/ssrn.1030107.
[5] Bhakar, S., Sharma, P. and Kumar, S. (2024). Ownership Structure and Firm Performance: A Comprehensive Review and Empirical Analysis.Journal of the knowledge economy. Doi:https://doi.org/10.1007/s13132-024-01893-1.
[6] Bolatto, S. and Pignataro, G. (2023). Equity‐settled share‐based payments and their (strategic) use under asymmetric information.Journal of Public Economic Theory, 25(5), pp.1012–1042. doi:https://doi.org/10.1111/jpet.12657.
[7] Carlin, T.M. and Ford, G. (2006). A Governance Perspective on Executive Options Plans - Reflections on Some Australian Empirical Evidence.Australia Accounting Review, 16(1). doi:https://doi.org/10.2139/ssrn.536482.
[8] CFI Team (2023).Market to Book Ratio. [online] Corporate Finance Institute. Available at: https://corporatefinanceinstitute.com/resources/valuation/market-to-book-ratio-price-book/ [Accessed 13 Jul. 2024].
[9] Core, J.E., Guay, W.R. and Larcker, D.F. (2003). Executive Equity Compensation and Incentives: A Survey.Federal Reserve Bank of New York Economic policy review, 9(1), pp.27–50.
[10] Dai, L., Dharwadkar, R., Shi, L. and Zhang, B. (2017). The governance transfer of blockholders: Evidence from block acquisitions and earnings management around the world.Journal of Corporate Finance, 45(2017), pp.586–607. doi https://doi.org/10.1016/j.jcorpfin.2017.06.004.
[11] Deb, P. and Wiklund, J. (2016). The Effects of CEO Founder Status and Stock Ownership on Entrepreneurial Orientation in Small Firms.Journal of Small Business Management, 55(1), pp.32–55. doi:https://doi.org/10.1111/jsbm.12231.
[12] Edmans, A., Gabaix, X. and Jenter, D. (2017). Executive Compensation: A Survey of Theory and Evidence.European Corporate Governance Institute (ECGI) - Finance Working Paper, 514(2016). doi:https://doi.org/10.2139/ssrn.2992287.
[13] Faulknder, M. and Wang, R. (2006). Corporate Financial Policy and the Value of Cash.The Journal of Finance, 61(4), pp.1957–1990. doi https://doi.org/10.1111/j.1540-6261.2006.00894.x.
[14] Galbo, S. (2020).The impact of share-based payments on financial performance and valuation considerations. [online] Propel your future (PKF). Available at: https://www.pkf.com.au/insights/the-impact-of-share-based-payments-on-financial-performance-and-valuation-considerations/ [Accessed 13 Jul. 2024].
[15] Giner, B. and Arce, M. (2012). Lobbying on Accounting Standards: Evidence from IFRS 2 on Share-Based Payments.European Accounting Review, 21(4), pp.655–691. doi https://doi.org/10.1080/09638180.2012.701796.
[16] Griffith, J.M., Fogelberg, L. and Weeks, H.S. (2002). CEO ownership, corporate control, and bank performance.Journal of Economics and Finance, 26(2), pp.170–183. doi:https://doi.org/10.1007/bf02755984.
[17] Guerdon Associates Remuneration & Governance. (2006).Is There A Relationship Between CEO Share Ownership and Performance? | Guerdon Associates. [online] Available at: https://www.guerdonassociates.com/articles/is-there-a-relationship-between-ceo-share-ownership-and-performance/ [Accessed 13 Jul. 2024].
[18] Hamidlal, K.E. and Harymawan, I. (2021). Relationship Between CEO Power and Firm Value: Evidence from Indonesian Non-Financial Companies.Jurnal Dinamika Akuntansi dan Bisnis, 8(1), pp.15–26. Doi:https://doi.org/10.24815/jdab.v8i1.17942.
[19] Hassan, S.U. and Ahmed, A. (2012). Corporate Governance, Earnings Management, and Financial Performance: A Case of Nigerian Manufacturing Firms.American International Journal of Contemporary Research, 2(7), pp.214–226.
[20] Huang, R., Marquardt, C.A. and Zhang, B. (2013). Why do managers avoid EPS dilution? Evidence from debt-equity choice.Review of Accounting Studies, 19(2), pp.877–912. doi:https://doi.org/10.1007/s11142-013-9266-3.
[21] Jiraporn, P., Chintrakarn, P. and Liu, Y. (2011). Capital Structure, CEO Dominance, and Corporate Performance.Journal of Financial Services Research, 42(3), pp.139–158. doi:https://doi.org/10.1007/s10693-011-0109-8.
[22] Kijkasiwat, P., Hussain, A. and Mumtaz, A. (2022). Corporate Governance, Firm Performance and Financial Leverage across Developed and Emerging Economies.Risks, [online] 10(10), p.185. doi:https://doi.org/10.3390/risks10100185.
[23] Kothari, S.P., Mizik, N. and Roychowdhury, S. (2016). Managing for the Moment: The Role of Earnings Management via Real Activities versus Accruals in SEO Valuation.The Accounting Review, 91(2), pp.559–586. doi:https://doi.org/10.2308/accr-51153.
[24] Marr, B. (2012).Key performance indicators: the 75 measures every manager needs to know. Harlow, England; New York: Pearson Financial Times Pub.
[25] Neuberg, L.G. (2003). CAUSALITY: MODELS, REASONING, AND INFERENCE, by Judea Pearl, Cambridge University Press, 2000.Econometric Theory, 19(04). doi:https://doi.org/10.1017/s0266466603004109.
[26] Nizalova, O.Y. and Murtazashvili, I. (2016). Exogenous Treatment and Endogenous Factors: Vanishing of Omitted Variable Bias on the Interaction Term.Journal of Econometric Methods, 5(1), pp.71–77. doi:https://doi.org/10.1515/jem-2013-0012.
[27] Nyberg, A.J., Fulmer, I.S., Gerhart, B. and Carpenter, M.A. (2010). Agency Theory Revisited: CEO Return and Shareholder Interest Alignment.Academy of Management Journal, 53(5), pp.1029–1049. doi:https://doi.org/10.5465/amj.2010.54533188.
[28] Papadopoulos, K. (2019).CEO Ownership, Corporate Governance, and Company Performance. [online] The Harvard Law School Forum on Corporate Governance. Available at: https://corpgov.law.harvard.edu/2019/05/13/ceo-ownership-corporate-governance-and-company-performance/ [Accessed 13 Jul. 2024].
[29] Peterkort, R.F. and Nielsen, J.F. (2005). IS THE BOOK-TO-MARKET RATIO A MEASURE OF RISK?Journal of Financial Research, 28(4), pp.487–502. doi https://doi.org/10.1111/j.1475-6803.2005.00135.x.
[30] Rao, M., Khursheed, A. and Mustafa, F. (2020). The impact of concentrated leverage and ownership on firm performance: A case in Pakistan.Logforum, 16(1), pp.15–31. Doi:https://doi.org/10.17270/j.log.2020.375.
[31] Raoli, E. (2013). DO MANAGERS ENGAGE IN EARNINGS MANAGEMENT TO SUPPORT THE FIRM’S MARKET VALUATION?Corporate Ownership and Control, 10(2). doi https://doi.org/10.22495/cocv10i2c3art5.
[32] Redman, T.C. (2001).Data quality: the field guide. Boston: Digital Press.
[33] Rhaiem, K. and Amara, N. (2019). Learning from Innovation failures: a Systematic Review of the Literature and Research Agenda.Review of Managerial Science, 15(2021), pp.189–234. doi:https://doi.org/10.1007/s11846-019-00339-2.
[34] Saidu, S. (2019). CEO characteristics and firm performance: focus on origin, education, and ownership.Journal of Global Entrepreneurship Research, 9(1). doi:https://doi.org/10.1186/s40497-019-0153-7.
[35] Skapinker, M. (2015).Executive pay: The battle to align risks and rewards. [online] www.ft.com. Available at: https://www.ft.com/content/9265406a-eaaf-11e4-96ec-00144feab7de [Accessed 13 Jul. 2024].
[36] Swastika, D.L.T. (2013). Corporate Governance, Firm Size, and Earning Management: Evidence in Indonesia Stock Exchange.IOSR Journal of Business and Management, 10(4), pp.77–82. doi:https://doi.org/10.9790/487x-1047782.
[37] Tiong, D. (2017). Empirical Research: Getting Started with Stata.Australian Economic Review, 50(2), pp.236–250. doi:https://doi.org/10.1111/1467-8462.12225.
[38] Vintila, G. and Gherghina, S.C. (2012). An Empirical Investigation of the Relationship between Corporate Governance Mechanisms, CEO Characteristics, and Listed Companies’ Performance.International Business Research, 5(10). doi:https://doi.org/10.5539/ibr.v5n10p175.
[39] Wall Street Prep. (2023).Market to Book Ratio. [online] Available at: https://www.wallstreetprep.com/knowledge/market-to-book-ratio/ [Accessed 13 Jul. 2024].
[40] Wei, Q. (2019). CEO Power and Nonprofit Financial Performance: Evidence from Chinese Philanthropic Foundations.VOLUNTAS: International Journal of Voluntary and Nonprofit Organizations, 32(4). doi:https://doi.org/10.1007/s11266-019-00187-4.
Appendix
1.Formula
2.Code
3.Results
Author:Lanxin Jiang, Postgraduate Student of UNSW Business School
Yuan Qi, Associate Professor of Shanghai Lixin University of Accounting and Finance School of Business Administration